еҪ“еүҚдҪҚзҪ®: йҰ–йЎө >> ҝU‘еӯҰз ”з©¶ >> ҝU‘з ”ҳqӣеұ• >> жӯЈж–Ү
еҚ—ж“vжүҖеңЁpHе“Қеә”еһӢжҙ»жҖ§еҢ…иЈ…иҶңе®һзҺ°Ӣ№дhҙӢйұјзұ»ж–°йІңеәҰзӣ‘Ӣ№ӢдёҺи…Ҙе‘ійқ¶еҗ‘жҺ§еҲ¶ж–ҡwқўз ”究еҸ–еҫ—ж–°иҝӣеұ?/h3>
ҳq‘ж—ҘеQҢдёӯеӣҪж°ҙдә§з§‘еӯҰз ”ҪIүҷҷўеҚ—ж“vж°ҙдс”з ”з©¶жүҖйҷўзс”ж°ҙдс”е“ҒзІҫж·ұеҠ е·ҘдёҺй«ҳеҖјеҢ–еҲ©з”ЁеҲӣж–°еӣўйҳҹеңЁеӣҪйҷ…е·ҘҪEӢзұ»TopжңҹеҲҠгҖ?span style="font-family: "times new roman";">Carbohydrate PolymersгҖӢпјҲQ1еQҢдёӯҝU‘йҷўдёҖеҢәTOPеQҢIF=12.5еQүдёҠеҸ‘иЎЁйўҳдШ“гҖ?span style="font-family: "times new roman";">ChitosanвҖ‘titanium dioxide emulsion incorporated pH-responsive active packaging film: Real-time freshness monitoring and targeted fishy odor controlгҖӢзҡ„з ”з©¶жҖ§и®әж–ҮгҖӮи®әж–Ү第дёҖдҪңиҖ…дШ“иҒ”еҗҲеҹ№е…»з ”究з”ҹеҗҙдәҡжў…еQҢйҖҡи®ҜдҪңиҖ…дШ“еҚ—ж“vжүҖзҺӢжӮҰйҪҗз ”ҪI¶е‘ҳгҖҒеҗҙзҮ•зҮ•з ”究е‘ҳгҖ?/p>
Ӣ№дhҙӢйЈҹе“ҒеңЁиҙ®и—ҸиҝҮҪEӢдёӯе®ТҺҳ“еҸ‘з”ҹе“ҒиҙЁеҠЈеҸҳеQҢеҜјиҮҙиҗҘе…ЦMӯhеҖје’Ңе•Ҷдёҡд»·еҖйgёӢйҷҚпјҢеҗҢж—¶еҫ®з”ҹзү©иҝҮеәҰз№ҒҢD–д№ҹдјҡеўһеҠ йЈҹжәҗжҖ§з–ҫз—…йЈҺйҷ©пјҢеҜ№дқhдҪ“еҒҘеәдhһ„жҲҗеЁҒиғҒгҖӮдј ҫlҹеЎ‘ж–ҷеҢ…иЈ…йҡҫд»ҘжҸҗдҫӣжҠ—иҸҢгҖҒжҠ—ж°§еҢ–е’ҢзӮчеӨ–йҳІжҠӨзӯүеҠҹиғҪеQҢдё”дёҚеҸҜз”ҹзү©йҷҚи§ЈеQҢж—ўдёҚеҲ©дәҺзҺҜеўғдҝқжҠӨпјҢд№ҹж— жі•ж»Ўӯ‘ізҺ°д»Јж°ҙдә§е“ҒдҝқйІңзҡ„йңҖжұӮгҖӮеӣ жӯӨпјҢејҖеҸ‘зҺҜеўғеҸӢеҘҪгҖҒеҸҜжҢҒз®ӢеQҢеЖҲиғҪеӨҹжңүж•ҲеҮҸе°‘ж°ҙеҲҶӢ№ҒеӨұгҖҒжҠ‘еҲ¶ж°§еҢ–е’Ңеҫ®з”ҹзү©з”ҹй•ҝзҡ„еҢ…иЈ…жқҗж–ҷеQҢе·ІжҲҗдШ“еҪ“еүҚзҡ„з ”ҪI¶зғӯзӮҸVҖӮеӨ©з„¶з”ҹзү©иҒҡеҗҲзү©еӣ е…¶иүҜеҘҪзҡ„жҲҗиҶңжҖ§гҖҒе®үе…ЁжҖ§е’Ңз”ҹзү©еҸҜйҷҚи§ЈжҖ§пјҢиў«е№ҝжіӣи§ҶдҪңзҗҶжғПxӣҝд»Јжқҗж–ҷпјҢ然иҖҢзҺ°жңүз”ҹзү©еҹәеҢ…иЈ…д»ҚеӯҳеңЁжҙ»жҖ§жҲҗеҲҶжҳ“жҢҘеҸ‘гҖҒж°ҙжә¶жҖ§е·®еҜЖDҮҙеҠҹиғҪдёҚзЁіе®ҡзӯүй—®йўҳеQҢеҗҢж—¶зјәд№ҸеҜ№дә§е“Ғж–°йІңеәҰзҡ„е®һж—¶еҸҜи§ҶеҢ–зӣ‘Ӣ№ӢиғҪеҠӣпјҢйҡҫд»Ҙе®һзҺ°ж°ҙдс”е“ҒдҝқйІңдёҺе®үе…Ёйў„иӯҰдёҖдҪ“еҢ–гҖ?/p>
й’ҲеҜ№дёҠиҝ°дә§дёҡжҠҖжңҜ瓶йўҲпјҢз ”з©¶еӣўйҳҹд»Ҙз”ҹзү©зӣёе®ТҺҖ§дјҳејӮгҖҒжҲҗиҶңжҖ§иүҜеҘҪзҡ„жҳҺиғ¶дёәеҹәжқҗпјҢһ®Ҷе§ңй»„зҙ иҙҹиқІеҲ°CS-TiOвӮӮдг^ж¶Ізҡ„жҳҺиғ¶еҹшҷҶңдёӯпјҢиөӢдәҲиҶңpHе“Қеә”жҷшҷғҪзӣ‘жөӢеҠҹиғҪеQҢжһ„е»ЮZәҶйӣҶжҙ»жҖ§дҝқйІ?жҷшҷғҪзӣ‘жөӢ-зҺҜеўғеҸӢеҘҪдәҺдёҖдҪ“зҡ„ж°ҙдс”е“ҒжҷәиғҪеҢ…иЈ…иҶңгҖӮиҜҘи–„иҶңе…·еӨҮзҒү|•ҸеҸҜйҖҶзҡ„pHе“Қеә”иЎҢдШ“еQҢеҸҜеҜҡwұјҫc»и…җиҙҘиҝӣҪEӢиҝӣиЎҢе®һж—¶гҖҒеҸҜи§ҶеҢ–зӣ‘жөӢзҡ„иғҪеҠӣпјҢжңүж•ҲжҠ‘еҲ¶дәҶж“vӢzӢйұјҫcЦMјҳеҠҝи…җиҙҘиҸҢзҡ„еўһҢD–пјҢдёәж“vӢzӢйЈҹе“Ғз»ҝиүІзҺҜдҝқеһӢй«ҳжҖ§иғҪжҷшҷғҪеҢ…иЈ…зҡ„ејҖеҸ‘жҸҗдҫӣдәҶеҲӣж–°Ҫ{–з•ҘдёҺзҗҶи®әжҠҖжңҜж”Ҝж’‘гҖ?/p>
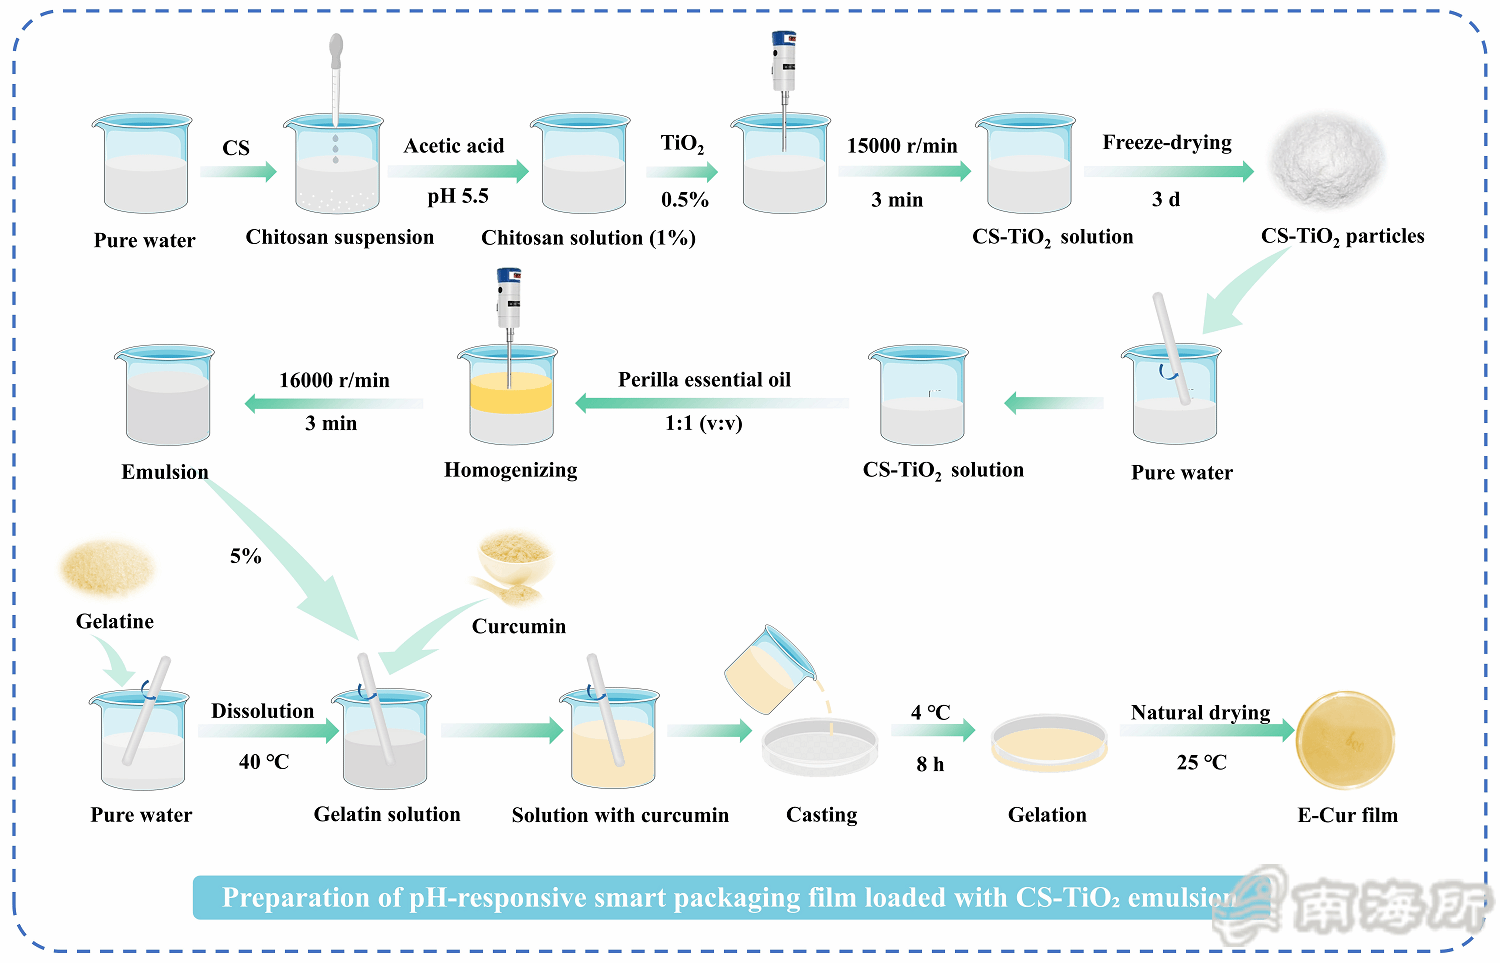
Fig. 1 Schematic diagram of the preparation process of pH-responsive smart packaging film loaded with CS-TiOвӮ?emulsion.
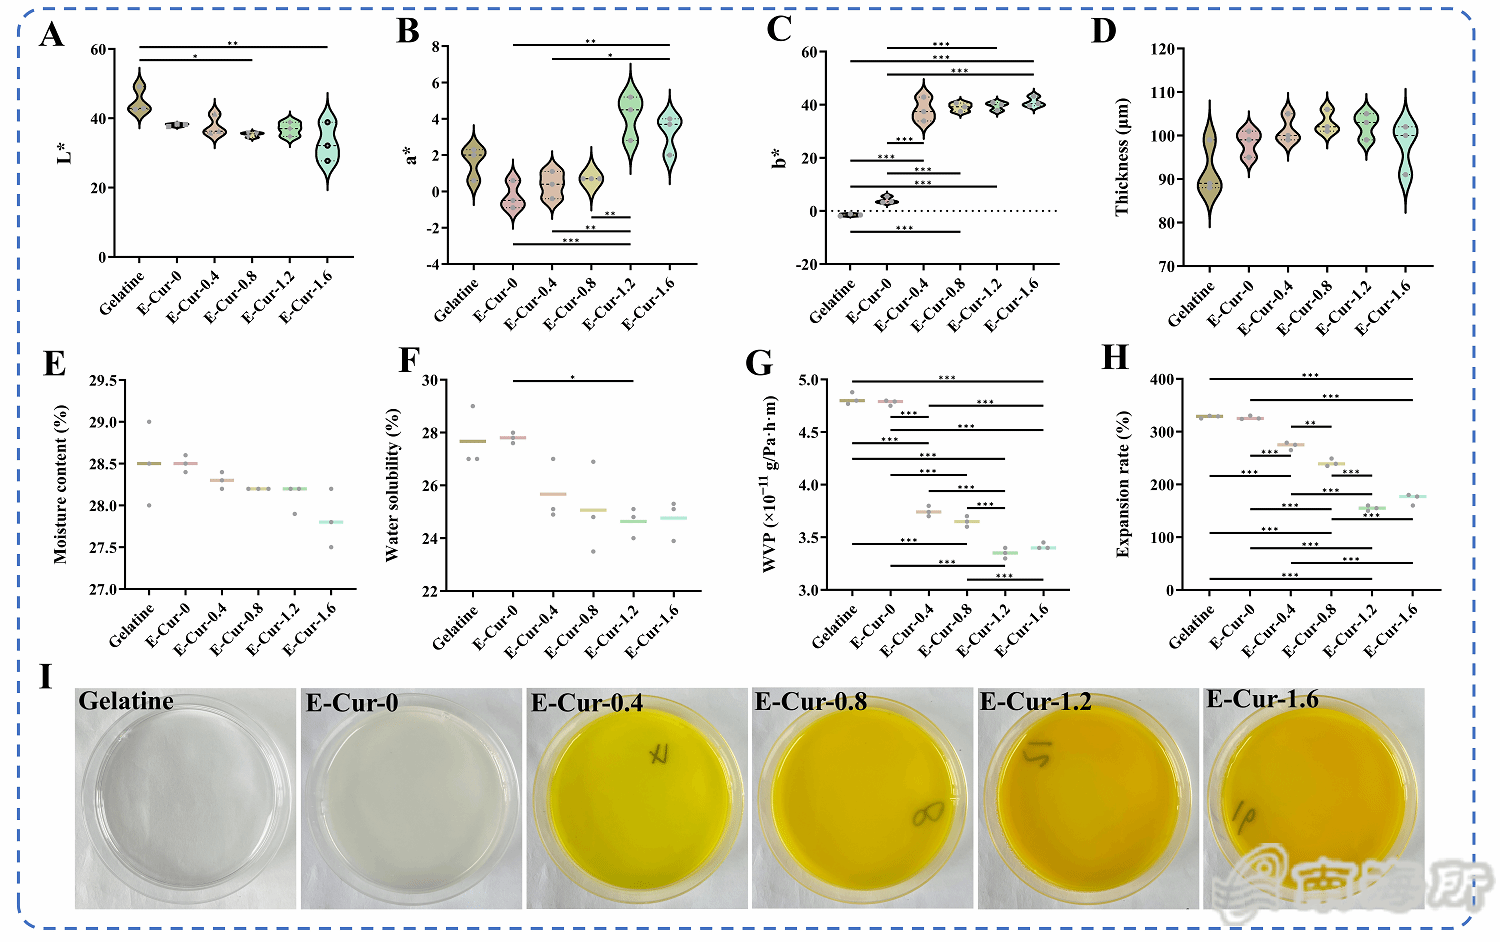
Fig. 2 Color parameters L* value (A), a* value (B), b* value (C), thickness (D), moisture content (E), water solubility (F), water vapor permeability (G), swelling rate (H), and digital image (I) of E-Cur
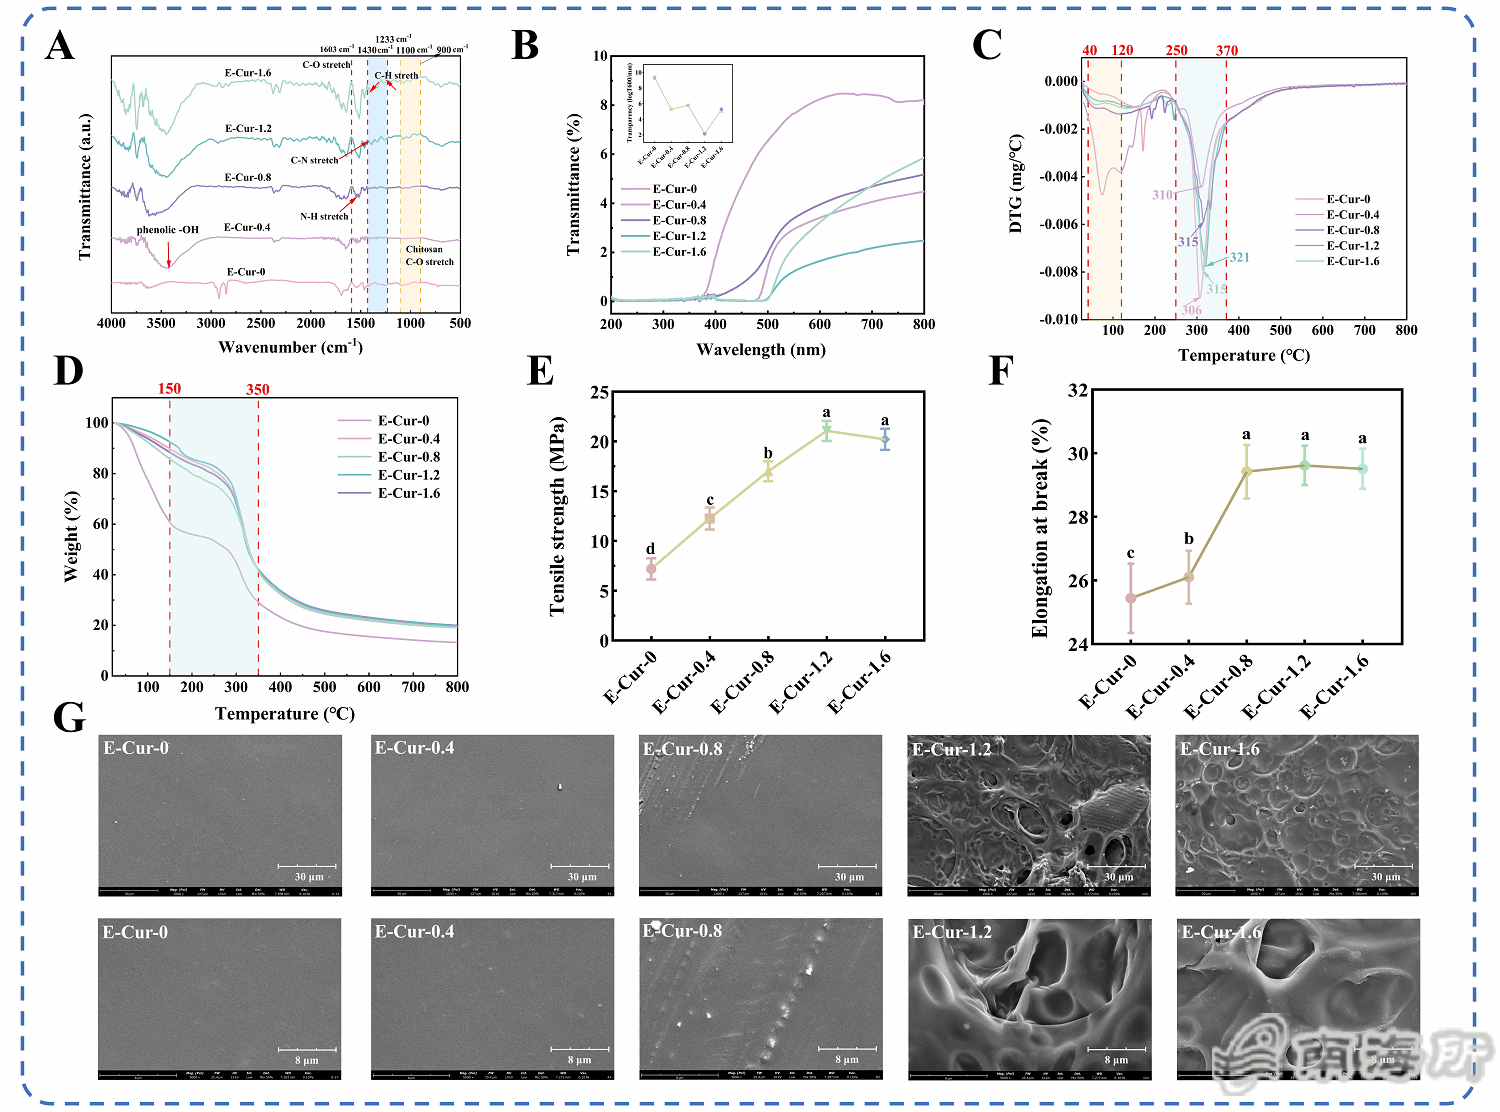
Fig. 3 FTIR spectrum (A), UV spectrum and transmittance (B), DTG curve (C), TGA curve (D), tensile strength (E), elongation at break (F), and surface microstructure (G) of E-Cur film.
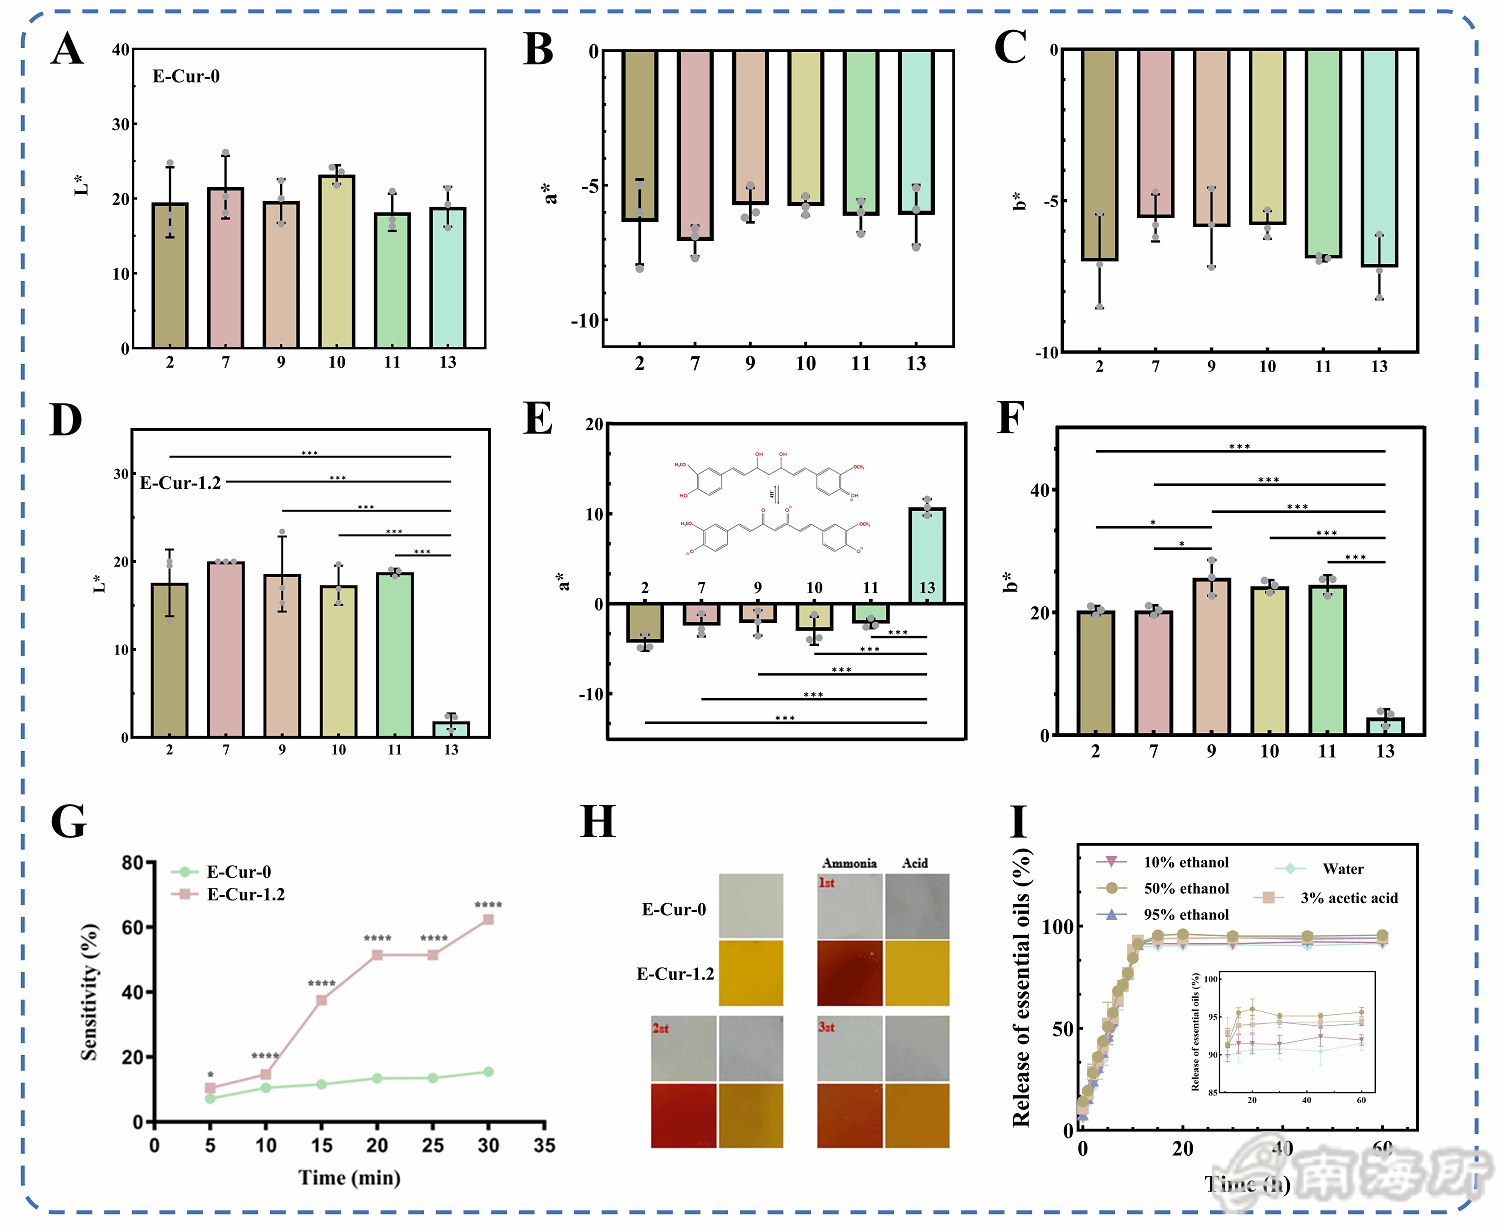
Fig. 4 Color parameters of E-Cur-0: L* value (A), a* values (B), b* values (C), and color parameters of E-Cur-1.2: L* values (D), a* values (E), b* values (F) under different pH conditions, sensitivity to ammonia vapor (G) and color reversibility (H) of E-Cur film, and evaporation of essential oils in different simulated solutions (I).
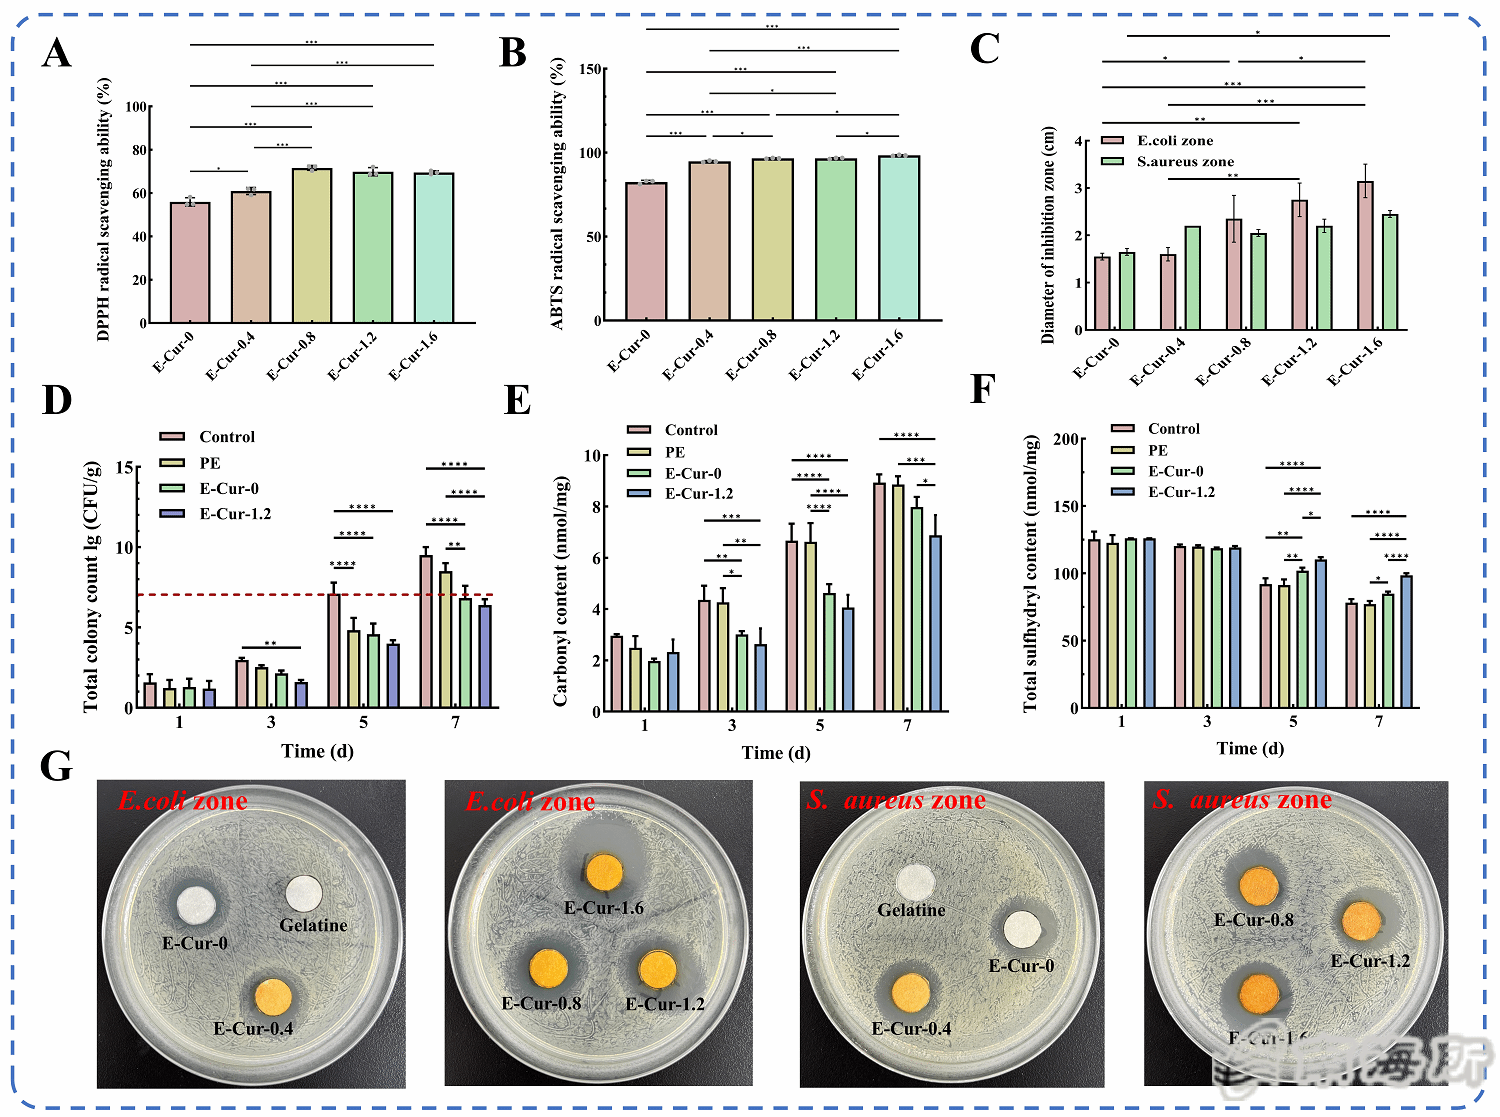
Fig. 5 DPPH radical scavenging rate (A), ABTS radical scavenging rate (B), and antibacterial zone diameter (C) of E-Cur film, total viable cell count (D), carbonyl content (E), and total sulfhydryl content (F) of fish meat at different storage days, and antibacterial zone (G) of E-Cur film.
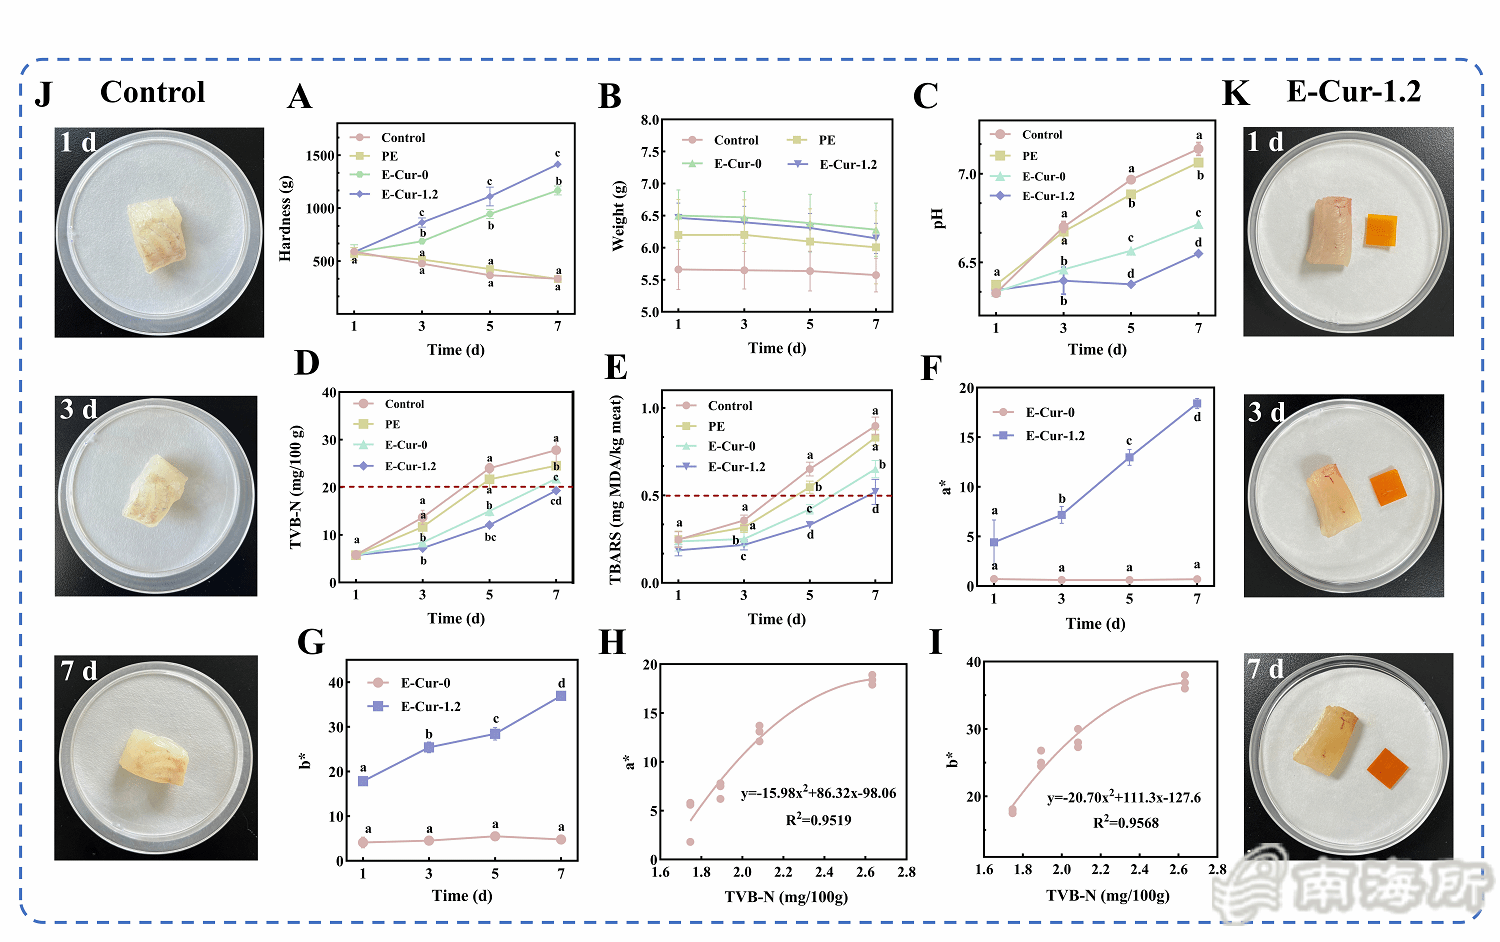
Fig. 6 Hardness (A), weight (B), pH value (C), TVB-N (D), TBARS content (E) of fish fillets at different storage days, color parameters a* value (F) and b* value (G) of the E-Cur film during storage, linear relationship between TVB-N and a* value (H), linear relationship between TVB-N and b* value (I), visual representation of fish fillets in the control group (J) and E-Cur-1.2 group (K) at different storage days.
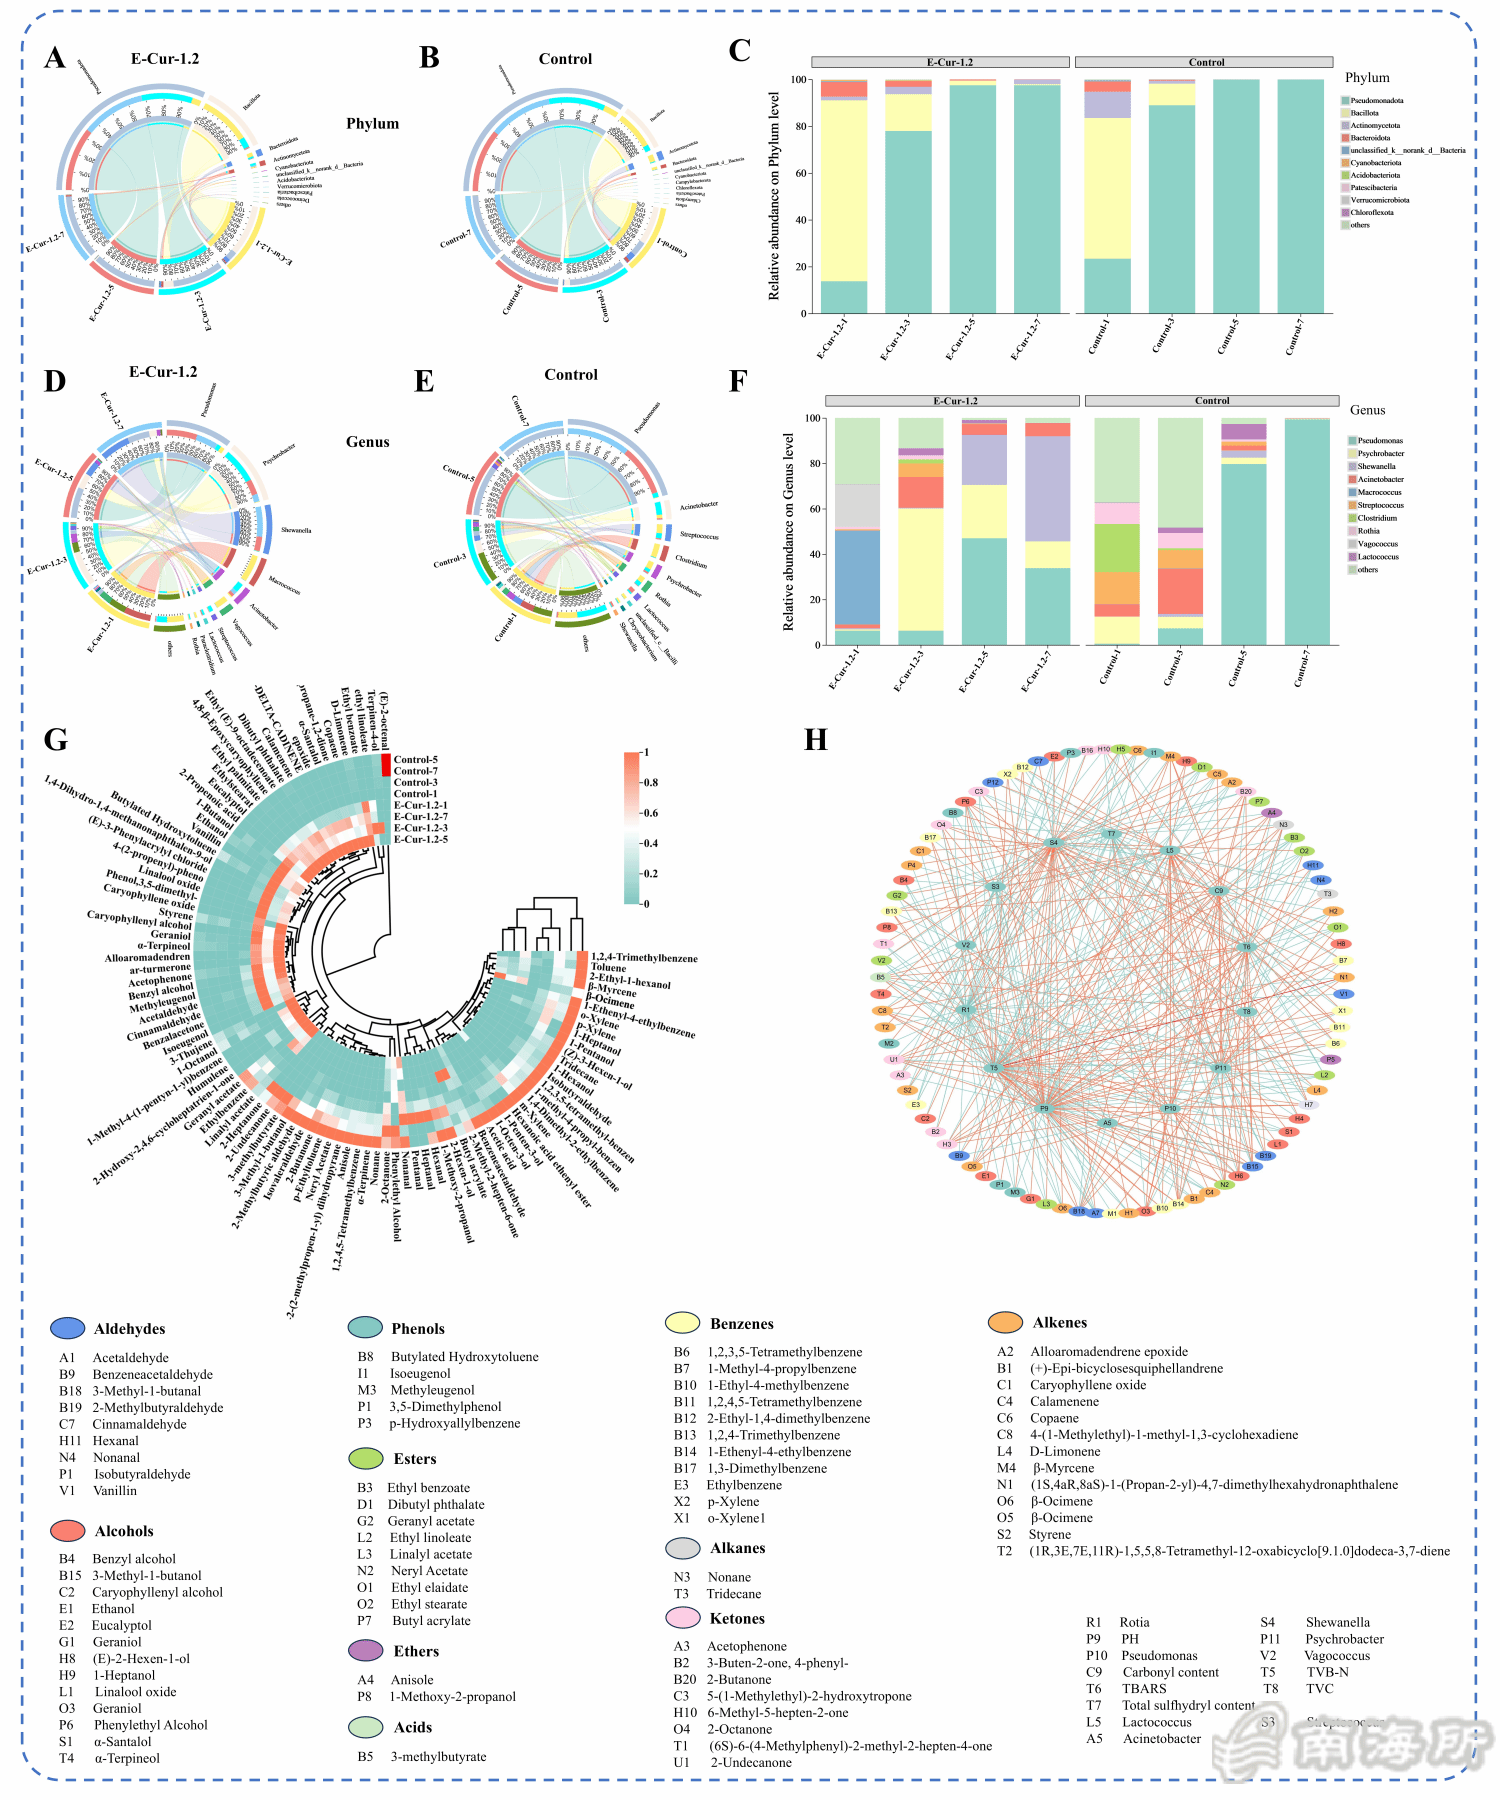
Fig. 7 Chord diagrams of relative abundance of bacterial colonies in fish fillets from the E-Cur-1.2 group (A) and the control group (B) at different storage days at the phylum level, relative abundance bar chart of fish fillets at different storage days at the phylum level (C), chord diagrams of relative abundance of bacterial colonies in fish fillets from the E-Cur-1.2 group (D) and the control group (E) at different storage days at the genus level, relative abundance bar chart of fish fillets at different storage days at the genus level (F), volatile compounds of fish fillets at different storage days (G), and correlation analysis (H).
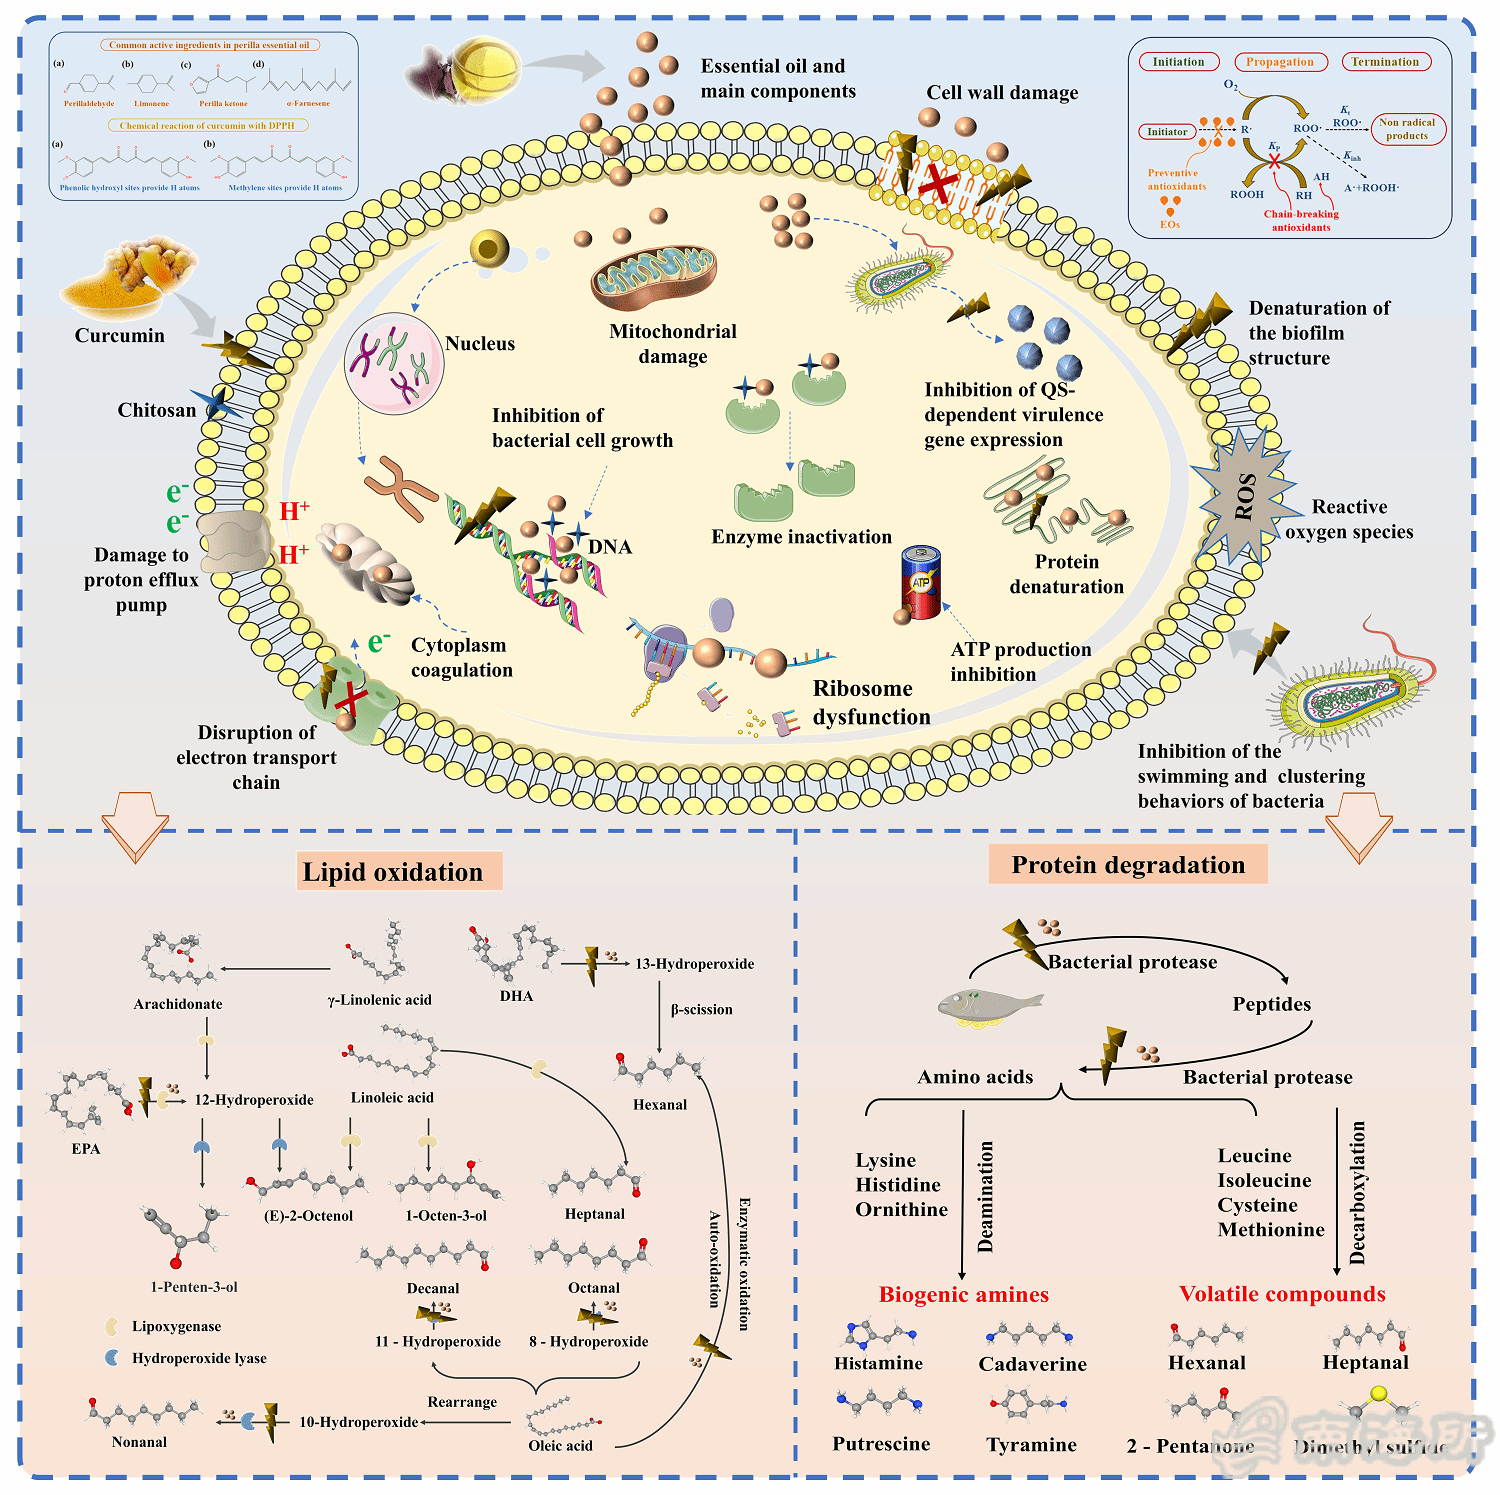
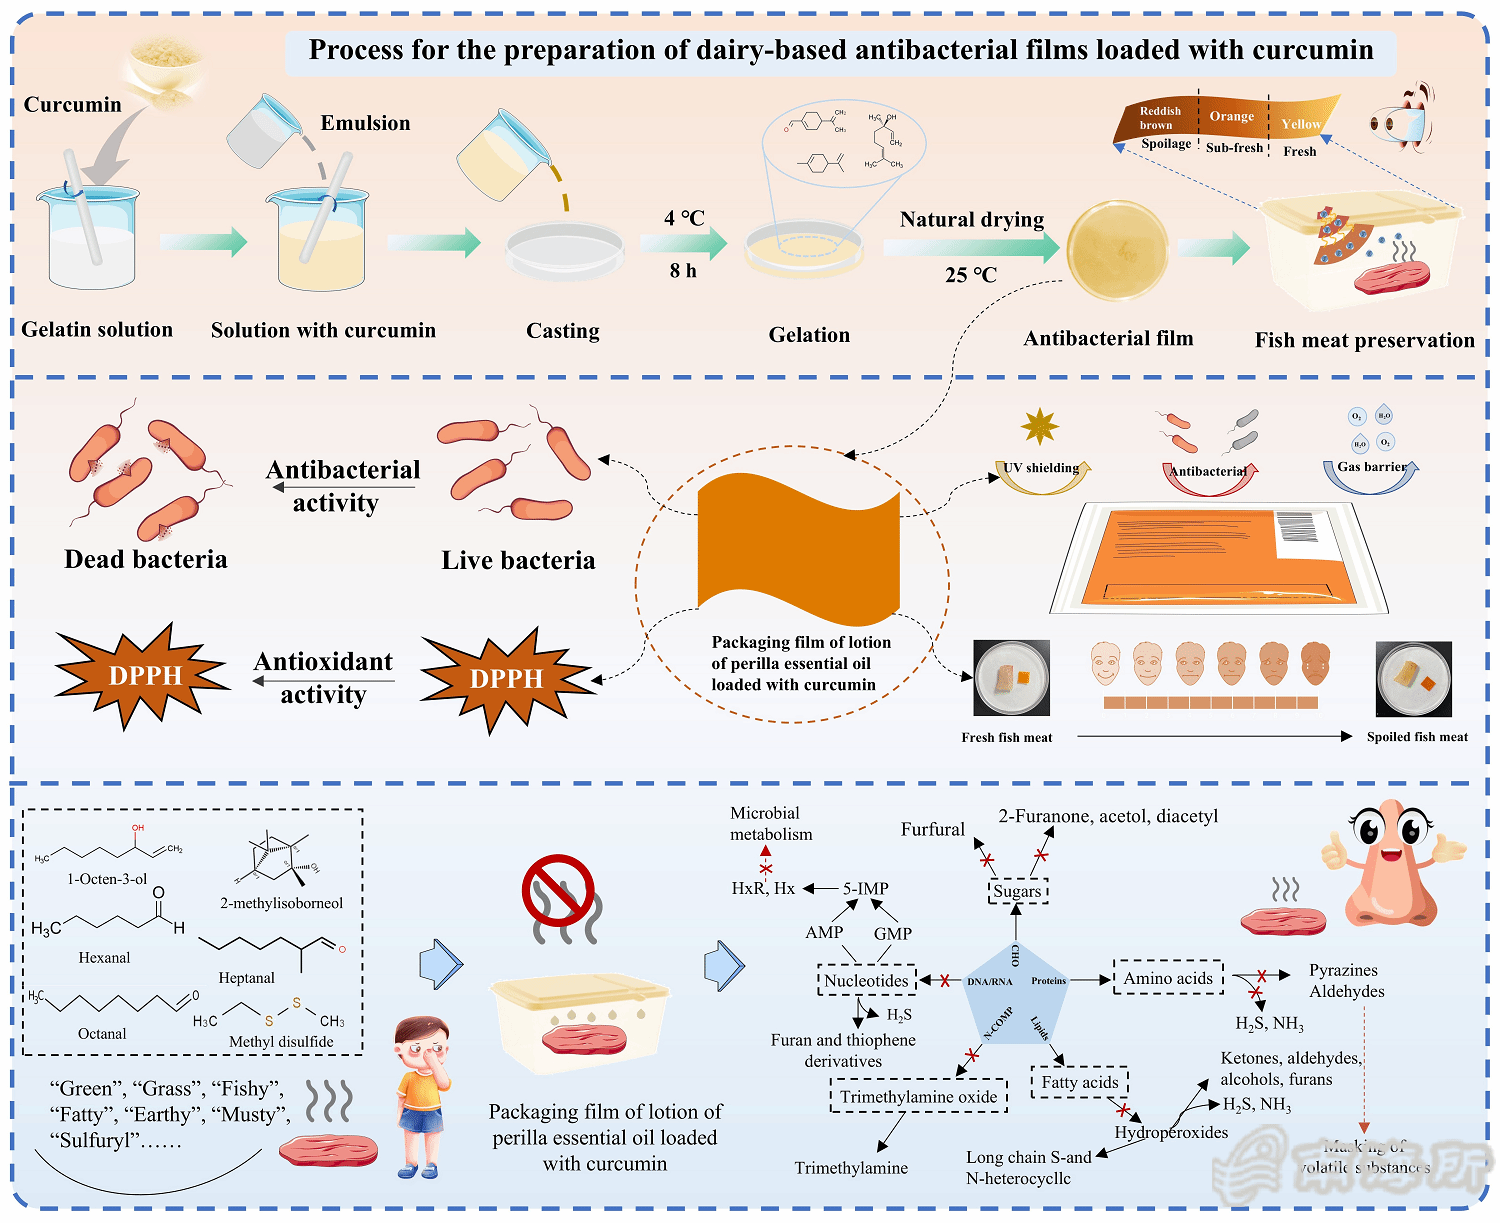
Fig. 8 Potential effects analysis of the antibacterial and deodorizing effects of pH-responsive smart packaging film loaded with CS-TiOвӮ?emulsion.
еҺҹж–Үй“ҫжҺҘеQҡhttps://doi.org/10.1016/j.carbpol.2025.124317
еҫ®дҝЎжү«дёҖжү?br>еҲҶднnеҲ°жңӢеҸӢеңҲ
ҳq‘ж—ҘеQҢдёӯеӣҪж°ҙдә§з§‘еӯҰз ”ҪIүҷҷўеҚ—ж“vж°ҙдс”з ”з©¶жүҖйҷўзс”ж°ҙдс”е“ҒзІҫж·ұеҠ е·ҘдёҺй«ҳеҖјеҢ–еҲ©з”ЁеҲӣж–°еӣўйҳҹеңЁеӣҪйҷ…е·ҘҪEӢзұ»TopжңҹеҲҠгҖ?span style="font-family: "times new roman";">Carbohydrate PolymersгҖӢпјҲQ1еQҢдёӯҝU‘йҷўдёҖеҢәTOPеQҢIF=12.5еQүдёҠеҸ‘иЎЁйўҳдШ“гҖ?span style="font-family: "times new roman";">ChitosanвҖ‘titanium dioxide emulsion incorporated pH-responsive active packaging film: Real-time freshness monitoring and targeted fishy odor controlгҖӢзҡ„з ”з©¶жҖ§и®әж–ҮгҖӮи®әж–Ү第дёҖдҪңиҖ…дШ“иҒ”еҗҲеҹ№е…»з ”究з”ҹеҗҙдәҡжў…еQҢйҖҡи®ҜдҪңиҖ…дШ“еҚ—ж“vжүҖзҺӢжӮҰйҪҗз ”ҪI¶е‘ҳгҖҒеҗҙзҮ•зҮ•з ”究е‘ҳгҖ?/p>
Ӣ№дhҙӢйЈҹе“ҒеңЁиҙ®и—ҸиҝҮҪEӢдёӯе®ТҺҳ“еҸ‘з”ҹе“ҒиҙЁеҠЈеҸҳеQҢеҜјиҮҙиҗҘе…ЦMӯhеҖје’Ңе•Ҷдёҡд»·еҖйgёӢйҷҚпјҢеҗҢж—¶еҫ®з”ҹзү©иҝҮеәҰз№ҒҢD–д№ҹдјҡеўһеҠ йЈҹжәҗжҖ§з–ҫз—…йЈҺйҷ©пјҢеҜ№дқhдҪ“еҒҘеәдhһ„жҲҗеЁҒиғҒгҖӮдј ҫlҹеЎ‘ж–ҷеҢ…иЈ…йҡҫд»ҘжҸҗдҫӣжҠ—иҸҢгҖҒжҠ—ж°§еҢ–е’ҢзӮчеӨ–йҳІжҠӨзӯүеҠҹиғҪеQҢдё”дёҚеҸҜз”ҹзү©йҷҚи§ЈеQҢж—ўдёҚеҲ©дәҺзҺҜеўғдҝқжҠӨпјҢд№ҹж— жі•ж»Ўӯ‘ізҺ°д»Јж°ҙдә§е“ҒдҝқйІңзҡ„йңҖжұӮгҖӮеӣ жӯӨпјҢејҖеҸ‘зҺҜеўғеҸӢеҘҪгҖҒеҸҜжҢҒз®ӢеQҢеЖҲиғҪеӨҹжңүж•ҲеҮҸе°‘ж°ҙеҲҶӢ№ҒеӨұгҖҒжҠ‘еҲ¶ж°§еҢ–е’Ңеҫ®з”ҹзү©з”ҹй•ҝзҡ„еҢ…иЈ…жқҗж–ҷеQҢе·ІжҲҗдШ“еҪ“еүҚзҡ„з ”ҪI¶зғӯзӮҸVҖӮеӨ©з„¶з”ҹзү©иҒҡеҗҲзү©еӣ е…¶иүҜеҘҪзҡ„жҲҗиҶңжҖ§гҖҒе®үе…ЁжҖ§е’Ңз”ҹзү©еҸҜйҷҚи§ЈжҖ§пјҢиў«е№ҝжіӣи§ҶдҪңзҗҶжғПxӣҝд»Јжқҗж–ҷпјҢ然иҖҢзҺ°жңүз”ҹзү©еҹәеҢ…иЈ…д»ҚеӯҳеңЁжҙ»жҖ§жҲҗеҲҶжҳ“жҢҘеҸ‘гҖҒж°ҙжә¶жҖ§е·®еҜЖDҮҙеҠҹиғҪдёҚзЁіе®ҡзӯүй—®йўҳеQҢеҗҢж—¶зјәд№ҸеҜ№дә§е“Ғж–°йІңеәҰзҡ„е®һж—¶еҸҜи§ҶеҢ–зӣ‘Ӣ№ӢиғҪеҠӣпјҢйҡҫд»Ҙе®һзҺ°ж°ҙдс”е“ҒдҝқйІңдёҺе®үе…Ёйў„иӯҰдёҖдҪ“еҢ–гҖ?/p>
й’ҲеҜ№дёҠиҝ°дә§дёҡжҠҖжңҜ瓶йўҲпјҢз ”з©¶еӣўйҳҹд»Ҙз”ҹзү©зӣёе®ТҺҖ§дјҳејӮгҖҒжҲҗиҶңжҖ§иүҜеҘҪзҡ„жҳҺиғ¶дёәеҹәжқҗпјҢһ®Ҷе§ңй»„зҙ иҙҹиқІеҲ°CS-TiOвӮӮдг^ж¶Ізҡ„жҳҺиғ¶еҹшҷҶңдёӯпјҢиөӢдәҲиҶңpHе“Қеә”жҷшҷғҪзӣ‘жөӢеҠҹиғҪеQҢжһ„е»ЮZәҶйӣҶжҙ»жҖ§дҝқйІ?жҷшҷғҪзӣ‘жөӢ-зҺҜеўғеҸӢеҘҪдәҺдёҖдҪ“зҡ„ж°ҙдс”е“ҒжҷәиғҪеҢ…иЈ…иҶңгҖӮиҜҘи–„иҶңе…·еӨҮзҒү|•ҸеҸҜйҖҶзҡ„pHе“Қеә”иЎҢдШ“еQҢеҸҜеҜҡwұјҫc»и…җиҙҘиҝӣҪEӢиҝӣиЎҢе®һж—¶гҖҒеҸҜи§ҶеҢ–зӣ‘жөӢзҡ„иғҪеҠӣпјҢжңүж•ҲжҠ‘еҲ¶дәҶж“vӢzӢйұјҫcЦMјҳеҠҝи…җиҙҘиҸҢзҡ„еўһҢD–пјҢдёәж“vӢzӢйЈҹе“Ғз»ҝиүІзҺҜдҝқеһӢй«ҳжҖ§иғҪжҷшҷғҪеҢ…иЈ…зҡ„ејҖеҸ‘жҸҗдҫӣдәҶеҲӣж–°Ҫ{–з•ҘдёҺзҗҶи®әжҠҖжңҜж”Ҝж’‘гҖ?/p>
Fig. 1 Schematic diagram of the preparation process of pH-responsive smart packaging film loaded with CS-TiOвӮ?emulsion.
Fig. 2 Color parameters L* value (A), a* value (B), b* value (C), thickness (D), moisture content (E), water solubility (F), water vapor permeability (G), swelling rate (H), and digital image (I) of E-Cur
Fig. 3 FTIR spectrum (A), UV spectrum and transmittance (B), DTG curve (C), TGA curve (D), tensile strength (E), elongation at break (F), and surface microstructure (G) of E-Cur film.
Fig. 4 Color parameters of E-Cur-0: L* value (A), a* values (B), b* values (C), and color parameters of E-Cur-1.2: L* values (D), a* values (E), b* values (F) under different pH conditions, sensitivity to ammonia vapor (G) and color reversibility (H) of E-Cur film, and evaporation of essential oils in different simulated solutions (I).
Fig. 5 DPPH radical scavenging rate (A), ABTS radical scavenging rate (B), and antibacterial zone diameter (C) of E-Cur film, total viable cell count (D), carbonyl content (E), and total sulfhydryl content (F) of fish meat at different storage days, and antibacterial zone (G) of E-Cur film.
Fig. 6 Hardness (A), weight (B), pH value (C), TVB-N (D), TBARS content (E) of fish fillets at different storage days, color parameters a* value (F) and b* value (G) of the E-Cur film during storage, linear relationship between TVB-N and a* value (H), linear relationship between TVB-N and b* value (I), visual representation of fish fillets in the control group (J) and E-Cur-1.2 group (K) at different storage days.
Fig. 7 Chord diagrams of relative abundance of bacterial colonies in fish fillets from the E-Cur-1.2 group (A) and the control group (B) at different storage days at the phylum level, relative abundance bar chart of fish fillets at different storage days at the phylum level (C), chord diagrams of relative abundance of bacterial colonies in fish fillets from the E-Cur-1.2 group (D) and the control group (E) at different storage days at the genus level, relative abundance bar chart of fish fillets at different storage days at the genus level (F), volatile compounds of fish fillets at different storage days (G), and correlation analysis (H).
Fig. 8 Potential effects analysis of the antibacterial and deodorizing effects of pH-responsive smart packaging film loaded with CS-TiOвӮ?emulsion.
еҺҹж–Үй“ҫжҺҘеQҡhttps://doi.org/10.1016/j.carbpol.2025.124317


 ҫ_Өе…¬ҫ|‘е®үеӨ?4010502001742еҸ?/a>